


🚦Trade Signals going off everywhere!
- White Oak University

- Nov 1, 2021
- 1 min read
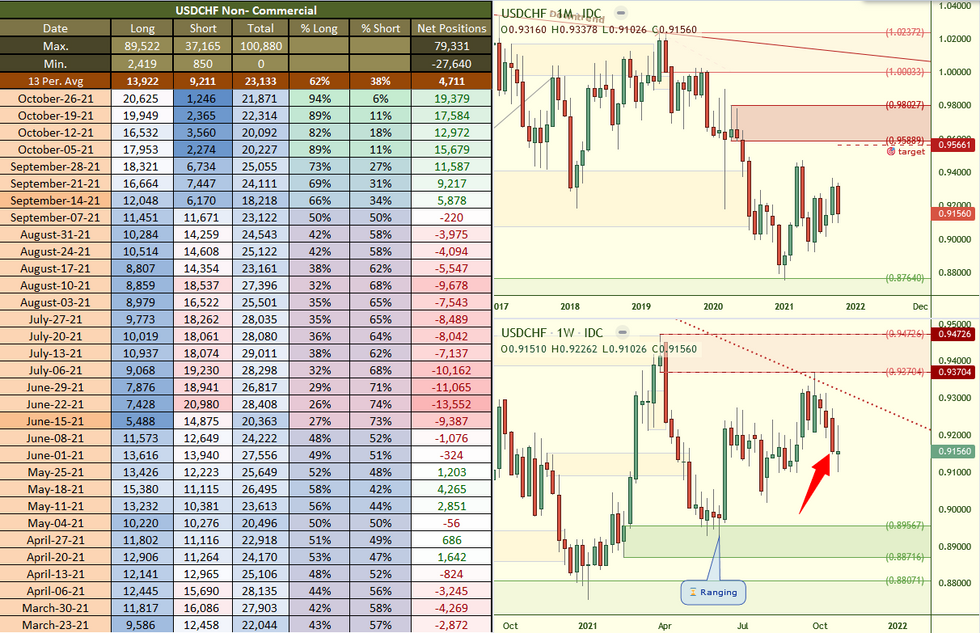
Based on the Commitments of Traders data reported on: October 26th 2021

#GOLD Weekly chart continues to range and the bottom line is we need a weekly uptrend to form to enter long otherwise we wait. On the other hand monthly chart shows evidence that demand might break and cause a drop lower.
On the 3 month chart, we have always mentioned how we had a 3 month bearish engulf that was formed and that we should keep an eye on that. Why? Because bearish engulfs typically

signal a bearish move until a demand is contacted and with this chart only a switch zone was contacted.
#OIL Weekly uptrend formed and now the chart is signaling for long trades. As long as weekly trend holds we expect targets at 92.05 to be reached.
#OIL Daily chart: We can see that there is substantial supply on the daily chart at 84.73 so this should be taken into consideration for any long trades that are open.
$EURUSD Monthly demand was removed and now we have the weekly downtrend engaging for a move lower.
The daily chart needs weekly supply to be in play to short or daily demand out. (Weekly supply in play)


🚨🏆 Win a FREE month tuition paid by us by following us on Twitter @WhiteOakFX and Retweet our links and SHARE our YouTube videos to continue getting them for FREE!
👇📺🚨 Watch a PREVIEW of what students receive 🚨📺👇
Comments