


April 11th 2021 - Institutional 🏦 Positions & Supply/Demand for Gold, Oil and the FOREX market
- White Oak University

- Apr 11, 2021
- 2 min read
Based on the Commitments of Traders data reported on: April 6th 2021

#GOLD The descending trend line on the daily chart became invalid which now turns our head to the main trend line that we have on the charts. For momentum to start building upwards we would need to see the supply zones indicated to be removed as well as this

trend line our focus of attention is currently on.
Monthly demand is still holding which is a good sign but looking at the 3 month chart we can see a bearish engulf was formed which typically means price will move the opposing
bullish engulf or in this case the demand zone.
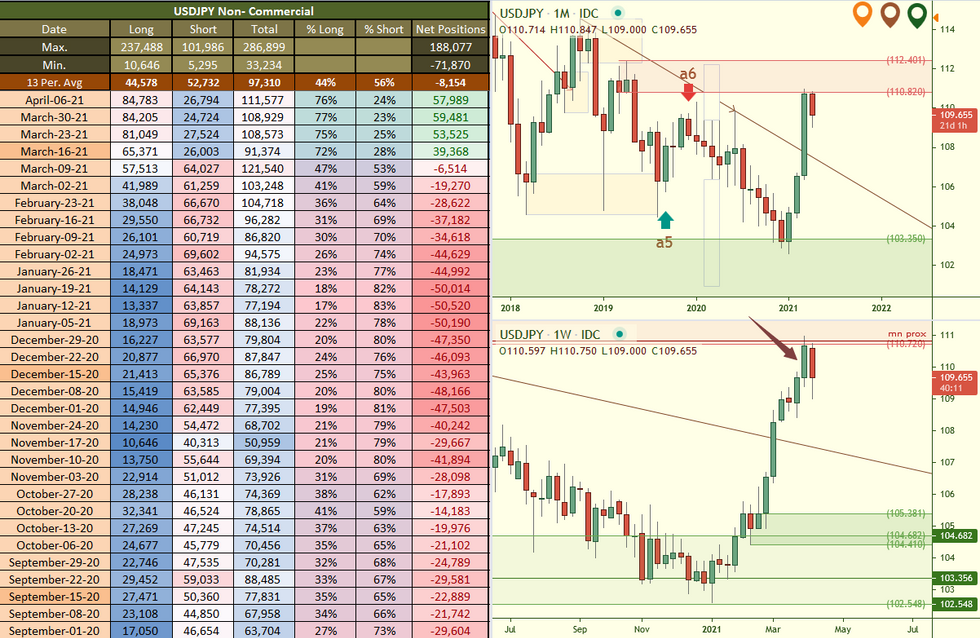
#USDOLLAR On the dollar chart we can see monthly supply is holding well and momentum has shifted on the H4 chart. What we were watching for was to see if this supply would hold and if the #USDJPY or #USDCHF would rally to contact its supply. The #USDJPY has done just that and now we have 3 of the 4 dollar pairs within major supply.
This builds up the argument that price should start to decline.
Look what took place this past week with the #DOLLAR, it dropped just as we laid out.
#EURUSD monthly chart shows us that the monthly supply is in play. Examining the #EUR pairs we can see some strength building which leads us to suspect that we could see some more upside take place BUT we need the weekly supply removed first.


🚨🏆 Win a FREE month tuition paid by us by following us on Twitter @WhiteOakFX and Retweet our links and SHARE our YouTube videos to continue getting them for FREE!
👇📺🚨 Watch a PREVIEW of what students receive 🚨📺👇

Comments